My Philosophy
Attentively
Blaming Ourselves
Good Customer Service versus Bad Regulation
Learning from Gandhi:
addressing the current
dilemmas in microfinance
Hinduism and Microfinance
The Financial Crisis
of 2007-2009:
A Sketch of a Credible Explanation
Money Market Funds, Bank Runs and the First-Mover Advantage
The Morality of Money Lending
The Case for Central Bank Liquidity Facilities for Institutional Money Market Funds in the Offshore Market
Creating Sustainable Micro-lending in London
Darwin and Philosophy
Financial Inclusion
and Equality
David Hume's "Of Suicide"
Is God a democrat?
The Risk Premium
for Commodities
|
Introduction
Understanding the nature and size of the risk premium for commodity investment, as for any other asset-class, is a necessary precursor to an informed decision about whether to include commodities in a strategic asset allocation. Despite a growing appetite for investing in commodities little has been published recently on the size of the risk premium associated with commodities, or for that matter whether commodity investors should expect a risk premium.1 This paper discusses the theoretical arguments for the existence of a risk premium for commodity investment and proposes an estimate of its size.
In recent years, various factors have led to an increased interest in alternative asset classes, such as commodities, property, private equity and hedge funds. Investors have experienced lower returns from equities and fixed income. Investors have felt the effects of a change in the seemingly stable relationship between equities and bonds - from a negative or negligible correlation to a positive correlation. Finally, institutional investors have attempted to match more closely their assets and their liabilities owing to increased regulation and more up-to-date valuation practices, leaving less capital to fund return seeking or growth strategies.
Thus, institutional investors are demanding more returns from their assets just at the time when core asset classes are providing less return and, if not less diversification, then less predictable diversification.
Recent empirical studies have investigated some of the attractive attributes of commodities, such as a low correlation with equities and bonds, a hedge against rising inflation and a counter-cyclical
investment within the economic cycle.2 While important and significant, we will not focus on these attributes but instead focus solely on the risk premium question.
A risk premium can be defined as: the sustainable return an investor receives in exchange for long-term financial exposure to a particular asset-class thereby assuming the risks associated with rises and falls in the market value of this asset-class. The risk premium is paid as a reward and incentive for taking risk above the "risk-free rate" but not a reward for predicting market movements. It is the reward for risk assumed (beta) and not for skill exhibited (alpha).
We define the forward-looking risk-free rate as the return on the 10-year US Treasury or its associated yield.3 For example, if the current 10-year US Treasury yields 4.2% and an asset class possesses a 2% risk premium, then it offers a forward-looking long-term return of 6.2%.
An economic commodity is generally a physical good that is often but not always a primary input to production processes that generate refined goods. For example, wheat is used to make a myriad of foodstuffs; copper is used as a raw material for electrical components; iron ore is melted to make molten steel. While there are many interesting commodities, old and new, this paper focuses on commodities as an asset class for the institutional investor. We will use the Goldman Sachs Commodity Index (GSCI), a set of individual futures on 24 different commodities, as the best proxy for the performance of commodities as an asset class.4 Our reasons for choosing an index of futures, rather than the physical commodities themselves, are given in section (C) below.
The literature on commodity investment is extensive, dating back to the start of the 20th century. Many prominent economists, including John Maynard Keynes, Frank Knight and Eugene Fama, have considered hypotheses for and against the existence of a commodity risk premium. In this paper we summarise what we believe to be the most compelling arguments; we make no pretence of providing an exhaustive survey of the literature.
This paper is organised as follows: (a) an empirical estimate of the risk premium; (b) a theoretical justification of the risk premium; (c) an analogy to the sources of equity and bond returns; (d) a decomposition of commodity returns; (e) expectations of the future size of the risk premium; (f) a review of arguments against the risk premium; and finally, (g) conclusions.
(A) An Empirical Estimate of the Risk Premium
The expected commodity return will first be estimated using empirical evidence. Later we will decompose the commodity return into its contingent parts and estimate each component separately.
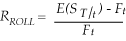
The expected commodity risk premium (CRP) is the difference between the expected return of the commodity investment (C) and the risk free rate (RF), specifically between the GSCI and the 10-year US Treasury (10y UST). More formally:

The historical risk premium is the ratio of the realised commodity return (GSCI) with the risk free rate, which in this case is the Long-Dated US Treasury Index (LDUSTI). This ratio is conveniently independent of currency and inflation exposure. More formally:
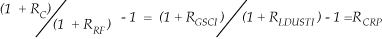
The forward-looking premium requires an arithmetic methodology while the backward-looking premium requires a geometric methodology. The long-term risk free rate is equivalent to the current 10-year yield or 4.22%.5
Chart 1 displays the returns of the major asset classes against the GSCI.
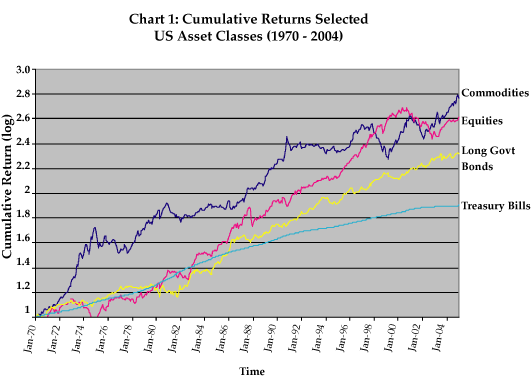
An investor would have received the following annual returns over this time period: 12.0% in commodities, 11.3% in US equities, 9.1% in long-dated US government bonds and 6.1% in short-dated US treasury bills. Thus, historically the commodity premium and US equity premium over long-dated US governments are 2.9% and 2.2% respectively.6 In each case we assume no transaction costs.
In line with financial theory, long-dated US government bonds exhibit a lower annual risk at 10.5%, than commodities and US equities at 18.5% and 15.5% respectively. In other words, the premia associated with commodities and US equities compensate the investor for assuming additional risk.
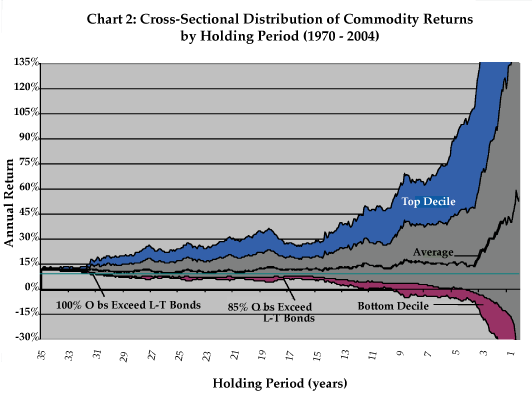
In order to visualise the commodity risk premia, the associated holding period and the associated volatility, we graph the cross-sectional returns for various holding periods.7
The cross-sectional comparison by holding period answers the question: what would an investor have received by holding commodities for 420 months? Since we have 420 months of
data we have one observation at 420 months or 35 years. An investor holding commodities for 419 months has two possibilities: to hold from the 1st to the 419th
month or from the 2nd month to the 420th month. Thus each reduction in the holding period increases the number of observations.
The commodity return converges at the long-term average, 12.0%, which corresponds to the previous analysis. The turquoise line at 9.1% represents the average return to long-term US government bonds.
Chart 2 illustrates several important truisms for investors in commodities. First, commodities are volatile, more so than US equities over the same period. For example, an investor holding commodities for any five year period during the last thirty-five years would have received a return ranging from -4.9% to 41.9% per annum.
Second, due to its high volatility and its connection with the global economic cycle the commodity risk premium requires a long-term investment, up to approximately 30 years for a US based investor. Based on the chart above, a 30-year 8-month investor would have beaten US government bonds 100% of the time. At approximately 16 years, an investor would have avoided all but the worst 15% of the possible commodity returns.
Third, commodity returns exhibit right tail skewness, more positive returns have been observed through time. Notice that the bottom decile is relatively thin in comparison to the top decile. This benefit is due in part to the components of the commodity return: the roll and the cash collateral return. The return on the cash collateral if invested in cash-like investments will not fall below zero, and the roll return has been more positive than negative over time.
We will explore this and other empirical evidence after we discuss the justification of the commodity risk premium.
(B) A Theoretical Justification of the Risk Premium
Discussions of the risk premium for commodities often refer to the views of John Maynard Keynes and in particular his argument in A Treatise on Money,
that producers of commodities are generally willing pay an insurance premium to hedge away their exposure to price risk. This idea goes back well before Keynes.8 However, his presentation of this idea is significant for two reasons.
First, Keynes addresses this issue in the context of a discussion about the costs of capital required to finance commercial production across the whole economy.
He is interested in what is necessary, from an investor's point of view, to attract capital into the various stages of the productive process such that an economy can maintain its
level of production at a rate commensurate with its capacity. Second, given that there is a reason why such investment should be rewarded,
Keynes also describes the mechanism by which this reward takes place. The mechanism that allows this premium to be paid, he suggests, is the persistent discount to fair-value of the price at which investors can buy contracts for the future delivery of commodities. As these contracts near expiry, their prices rise to fair-value, providing the investor with a profit. We will discuss this mechanism in more detail later.
The context for these ideas can be found in the work of a number of economists who, at the start of the twentieth century, compared the role of speculators in commodity markets with
the role of entrepreneurs in economic life more broadly. Entrepreneurs are people who facilitate a more efficient dispersal of risk (and reward) across the economically active population, by carrying out a distinct economic function that is separate from the loan of capital (for interest) and the sale of labour (for wages). An entrepreneur is someone who improves the efficiency, and thereby the profitability, of one or more elements of the productive processes, such as the manufacture or distribution of goods. This extra profit can be said to belong rightly to the entrepreneur rather than the owners of the business, or the workers in the business.
In the commodities markets, the producers of commodities (those who own farms, or mines, or oil wells) and the buyers of commodities (those who sell food, or metal goods, or who consume energy) make a return on the basis of their normal economic activity. The level of this return is set, primarily, by the degree of efficiency of their businesses: that is, by the quality and quantity of their outputs for a fixed unit of input. However, these normal returns can be jeopardised by unexpected fluctuations in commodity prices, due to sudden changes in the level of supply or demand of the commodity in question.
These producers and consumers are thought to be willing to pay an insurance premium to remove this price uncertainty, a process that is referred to as hedging. The premium is paid to speculators, that is, investors in the commodity markets who buy and sell purely for gain and not for any wider business purpose. The speculators assume the risk of price uncertainty and are paid an insurance-type premium for their service to the wider economy. By analogy with the entrepreneur, they are paid for the provision of an economic service, one that is unlike the other types of business activity performed in the market.
This idea has an appeal for investors because it implies that, irrespective of whether commodity prices tend to rise or fall over the short-, medium- or long-term, a speculator in commodities will still be paid for providing insurance to those who wish to hedge. In other words there are grounds for thinking that there will be a consistent positive return for an investor who can assign capital to this activity. Moreover, since this capital is not itself consumed in the act of speculation, but stands behind the speculator's positions just as insurance reserves stand behind the liabilities of an insurance company, the speculator can earn additional returns on this capital, in line with the level of real interest rates. The speculator is paid interest, as a lender of capital, in addition to premiums, as a provider of insurance.9
Before exploring in more detail the mechanics of an investment in the commodities markets, it is instructive to compare an investment in commodities with an investment in more traditional financial instruments, such as equities and bonds, which are generally accepted to provide an investor with a risk premium.
(C) An Analogy to the Sources of Equity and Bond Returns
What makes financial investment different from investment in a business? One way to address this question is to distinguish between buying an asset such as a share, from buying an asset such as a machine or a heap of steel. The share activity can be described as a financial investment and the asset activity as a business investment. Even though financial assets such as commercial loans are frequently used as mechanisms for raising cash to purchase business assets, these two types of investment activity are very different.10
Financial investment differs from business investment in that the asset is bought (or sold) because of an expectation that its price will change. Sometimes assets that are normally considered business assets might be bought as financial assets. For example someone might buy a heap of steel not because they plan to make anything, but because they believe the price of steel will rise and they will be able to sell the steel for profit. As this example illustrates, the distinction between financial investment and business investment is based upon the intention of the purchaser and not the character of the asset that is purchased.
What makes an asset suitable for financial investment? In principle, any asset might be bought "for profit", but in practice some assets are much more suitable for financial investment than others. In general the sorts of assets that make good financial investments are assets which are easy to buy and sell, have liquid and transparent markets, are easy to store, that is assets that do not deteriorate over time and whose storage costs are cheap proportionate to their value. Liquid and transparent markets imply the standardization of products while cheap and easy storage implies low costs of carry. This combination of features is rare, which is why most assets do not generally make good financial assets, even though it is possible to buy and sell them for profit on occasion.
The obvious candidates for financial investment are financial assets such as equities and bonds. These assets represent claims or titles on future cash flows, determined by legal prospectus or covenant. They tend to be issued and traded on public markets, with multiple buyers and sellers, supported by the trading activities of brokers. While the markets for equities and bonds vary, at best they are liquid and transparent, meaning that the difference at any moment between the buying price and the selling price - the spread - is narrow.
The carry costs of shares and bonds are low. Many of these assets are now de-materialized, that is there are electronic records only, which are inexpensive to maintain, and those which are still recorded on paper are still cheap relative to the value of the shares themselves. Finally, shares and bonds do not lose value through physical deterioration: they do not fall in price owing to rust, evaporation, or some other physical process.
We have defined financial investment in terms of the anticipation of a change in the value of the asset owned, which could also be described as the expectation of a future capital
gain or loss. However, there are other reasons for buying financial assets, namely to benefit from regular income which is either guaranteed as part of the prospectus of the title, for example the coupon stream from a bond, or which is expected based on the past behaviour of the issuer of the title, for example the dividend stream from an equity. These regular payments to holders of the title are independent of any anticipated capital gain or loss, since they are not based on any expectation that the price of the bond or the equity will change. The value of these cash flows to the investor constitutes the yield.11
All assets can be said to have a yield, which is the return they obtain "measured in terms of themselves".12 For financial assets the yield is comprised of the coupon stream or dividend stream. For property the yield is comprised of the rental income that can be obtained by letting the property. For an asset that is used in a productive process, the yield may be the value that is added to the end product or service as a result of the consumption of the asset in the productive process, for example the yield on steel may be measured as the value added to the construction of a car, over and above the value added by the other components. For some assets, their yield is related to their immediate availability, that is the value that accrues to the owner in being able to get access to them immediately and not to have to wait for them to be delivered when they are needed (known as the convenience yield).
To summarize, while all assets provide a return to their owners (the yield) some assets provide an additional capital gain (or loss) based on a rise (or fall)
in the price of the asset. The yield of an asset is an important part of the risk premium of that asset class, that is, the average annual return to an investor for
taking financial exposure to the asset-class in question. The yield is that part of the risk premium that is independent of the average capital gain.
When an asset is bought (or sold) with the expectation of a capital gain (or loss), we refer to it as an investment asset, and the process of buying and selling investment assets
we refer to as financial investment.13 The best sorts of assets for successful financial investment are those for which there are liquid and open markets and low carry costs, namely bonds and equities.
Modern economies rely on the large-scale harvesting and extraction of various raw materials that are used in the production of goods for public consumption
(such as coffee beans, copper, timber and crude oil). These raw materials, or commodities, are often traded on public exchanges in standardized measures of size and quality,
which allows for greater efficiencies in the extraction, distribution and consumption processes. These exchanges also allow for speculative activity (i.e. financial investment)
in commodities, separate from routine commercial purchases and sales of commodities for use in the productive process.14 How does financial investment in commodities compare with financial investment in bonds and shares?
In some respects commodities do look to be the sorts of assets that are suitable for financial investment, in that they trade in standardized form on public exchanges, where liquidity and transparency are good. However, most commodities are expensive to store and, in certain cases, their quality deteriorates in storage, which means that their costs of carry can be high. These negative features vary according to the commodity in question. Natural gas, for example, is expensive to store and to transport since it has to be held in liquid form at sub-zero temperatures. Metals tend not to deteriorate over time, whereas grains and livestock do. Gold is costly to store because it requires expensive security.
One way of avoiding these carry costs is to invest not in physical commodities themselves, but in financial instruments whose value is determined in some way by the prices of
physical commodities, such as futures, swaps or options. Some of these derivative instruments trade on public markets, where liquidity and transparency are good,
and the carry costs are low because they are title (in electronic or paper form) to future cash flows and as such the cost of storage is negligible with little deterioration over
time.15 Thus, commodity futures do look to be appropriate for financial investment, just as equities and bonds are.
(D) A Decomposition of Commodity Returns
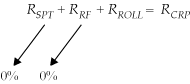
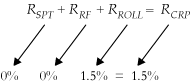
Investors in commodity futures earn a risk premium (RCRP) that can be broken down into three elements. The spot return (RSPT), the cash collateral return (RRF) and the (RROLL).
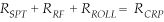
The first element (RSPT) represents the rise or fall in the price of a commodity in the spot market (that is, the market for immediate delivery) due to a change in the balance of
supply and demand of the physical commodity in question. This spot return equates to capital gains on equities or bonds. The second element (RRF) represents the interest
earned on collateral that backs the investor's futures position. This collateral is generally held in low risk securities, such as treasury bills, cash or fixed income assets,
which earn a return comparable to the nominal level of interest rates in the marketplace.16 This collateral return equates to the yield on equities and bonds.
The third element (RROLL) represents the return earned by rolling futures positions forward on a regular basis. This roll return equates to the insurance premium that Keynes and others have described.
Together these three elements constitute the risk premium for commodities (RCRP): the sustainable return an investor receives in exchange for long-term financial exposure to commodities, thereby assuming the risks associated with rises and falls in the value of the commodity index. We will return to the question of the level of the risk premium, once we have described each element in more detail.
The spot return
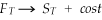
The spot return is the difference in the spot price between a commodity in the future at time T (ST) and a commodity in the present at time t (St).

Spot prices for commodities are notoriously volatile and difficult to forecast. Hence our expectations of a capital gain from a change in spot price are low as the spot return is not regular and investors who take delivery of actual commodities do so generally for business purposes and not as a financial asset. Investors in collateralised commodities rarely if ever take physical delivery of commodities. They possess an exposure to spot prices but this exposure is realised only when the investor takes delivery of the commodity. For collateralised commodity investors an operational risk exists around the delivery of commodities as these investors intend to finance the need for insurance in the market and not to exploit a business need that entails physical possession of the commodity.
Commodity prices exhibit wide swings in returns for a number of reasons. A sudden change in the demand for a commodity - unexpected cold weather that pushes up the demand for energy - or a sudden change in the supply of a commodity - the discovery of new oil or gas reserves that will be cheap and easy to extract - can lead to price volatility in either direction. Since commodity production and consumption are influenced by many factors that are difficult to forecast accurately - extreme weather, new technologies to aid detection and extraction, political risks that disrupt production and distribution, changes in taste and consumption patterns - the level of price volatility is also difficult to forecast accurately.
Further, the importance of particular commodities in the economy changes over time. When The Economist first published a commodity price index in 1864,
it included such items as tallow and silk and the index was denominated in sterling, the principal currency of international trade.17 The importance of particular goods and currencies has changed over time. Today the main commodity indices consist principally of energy products, agricultural products, industrial metal products and precious metals. At some point in the future their constituents may be very different: plastics instead of industrial metals, rights to software licences instead of precious metals, and renewable power cells rather than carbon-based energy products.
Equity and fixed income markets have been volatile in the past, and at certain times in certain places have been suspended or abolished altogether. These facts do not deter investors from buying equities and bonds. Moreover, just as the composition of commodity indices has changed to reflect the changing importance of various goods in the economic process, so the composition of the leading equity indices has changed as particular companies rise and fall in value. When Charles Dow first published the Dow Jones Industrial Average on May 26, 1896, it consisted of a dozen stocks and only one remains in the index today; General Electric.
The return on collateral
Investors who choose to take risk exposure using futures are able to benefit from the additional returns that are available from the investment of their collateral.
Buying or selling a commodity future requires only a small nominal amount of cash (called the initial margin), which is calculated as a percentage of the notional amount of the commodity future in question. The exact amount of cash required is usually based on the historical volatility of the contract in question, so, for example, the figure for crude oil futures might be around 8% of the nominal value, but for wool futures or copper futures it might only be around 2% to 3% of nominal value. Consequently, if an investor decided to take a $100mn exposure to an index of commodities, the initial margin requirement might only be $5mn, leaving $95mn to be invested as collateral.
The normal practice is to avoid high levels of risk with the collateral and invest the residual cash in T-bills or a money-market fund, an asset whose principal objective is the preservation of capital and liquidity. If the value of the position in commodity futures falls then the investor must raise capital quickly to meet additional margin requirements, known as the variation margin.
Although collateral is generally invested in low risk assets that seek to preserve capital and provide liquidity, these assets will also generate a return, which is likely to equate to the level of short-term nominal interest rates. This feature of collateral returns is important for two reasons. First, there is a low correlation between the nominal level of short-term interest rates and the spot return from commodity prices, so the collateral return provides diversification to the overall return achieved by the investor. Second, the collateral return tends to increase in periods of high inflation as central banks raise short-term rates in order to reduce the level of inflation in the economy, so the collateral return provides a form of inflation-hedge, which may make it attractive to some investors.
The roll return
Similar to the spot return, the roll return is the difference in the price of the nearby future at time
T (FT) and the current or most recent future at time t (Ft).

However, the concept of the roll return is somewhat nuanced, by comparison with the concept of the spot return. As time moves from t to T (t → T) the price of the nearby future (FT) should converge with the forwarding-looking spot price (ST), adjusted for financing and storage costs:
For simplicity we will ignore the financing and storage costs.
Any unexpected changes in the underlying spot price as time moves from t to T affect the price of the nearby future (FT), but the investor has already paid the price of the existing future (Ft), so, to denote the impact that changes in the underlying spot price have on the future price, we replace the spot price (ST) with the expected spot price at time T given its previous price at time t (E(ST/t)):
The derivation of the roll return is therefore different from the derivation of the spot return in that the future return involves a time component, unexpected movements in the underlying spot price and the associated costs, some of which are commodity specific. Additionally, the roll return, though not always positive does generate significantly less volatile returns.
Futures contracts expire on a regular basis, generally monthly or quarterly. When an investor buys or sells a contract, at the end of the contract's life they must roll their long or short position into the next contract to maintain their exposure, or face the prospect of delivering or receiving the physical commodity itself and terminating their position. The process of rolling from one contract into the next nearby contract is common across all futures markets.
When a commodity's forward price curve falls, then the roll process involves buying a futures contract that is trading cheaper than the earlier most mature futures contract.
In other words, the investor pays less for the contract they are buying than they receive for the contract they are selling.
When a series of futures contracts are priced in this way, the futures market is said to be in backwardation.
However, when expectations, as reflected in the spot market, are for the futures contract to rise, then the roll process involves selling the most mature contract for less than the
nearby future contract. In this case, the investor pays more for the contract they are buying than they receive for the contract they are selling.
The market is said to be in contango.
If futures markets trade in backwardation regularly over time, and if the degree of backwardation is significant relative to the degree of contango, then investors will tend to make money through the roll process. A market in backwardation can be interpreted as a market offering a premium for immediate delivery of the particular commodity. Conversely, contango denotes a penalty for possession of a commodity relative to possession of the commodity in a month's time, for example.
When the cost of storing and financing a commodity reaches the level of the penalty, the commodity market is said to have reached full carry. In other words, an arbitrage exists where it is more profitable to store a commodity and sell it forward (based on the current forward curve) than sell it at current prices. When full carry occurs producers will tend to store their commodity or otherwise delay its delivery to market and large brokers will tend to take delivery of the commodity and store it. For this reason the magnitude of contango in commodity markets is bounded at the lower end.
However, a commodity market in backwardation is not bounded at the upper end since there is no equivalent arbitrage opportunity. The real physical constraints that prevent immediate delivery of commodities that are in short supply tend to force spot prices ever higher relative to future prices, so long as buyers are willing to pay for immediate access.
Finally, recall that Keynes suggested that, irrespective of whether a futures market is trading in contango or backwardation, the price of the next futures contract is somewhat discounted against market expectations of the future spot price of the physical commodity. So, when an investor rolls their futures position, they will generally be buying the new contract at something less than its fair value. Keynes believed that this was the mechanism through which the insurance premium for commodity investment was paid to the speculator.
The combination of the gains made over time through the tendency of the commodities futures markets to be in backwardation and the gains made over time by the tendency of futures contracts to trade at a discount to fair value, makes up the roll return. This element of the overall return from commodities is the hardest to measure separately, since while the part that arises from backwardation can be identified, the part that arises from discount to fair value cannot easily be measured. Indeed, it is impossible in practice to distinguish this discount, which erodes over the lifetime of the futures contract, from changes in price due to other factors (i.e. the spot return).
Consequently the roll return is generally measured as the residual of the total return, once the spot return and the collateral return have been subtracted.
Historical measures of decomposed commodity returns
The following tables decompose the historical commodity returns over various time-periods. The arithmetic average and risk (standard deviation) are derived from monthly observations.
The average arithmetic return is used to derive the Sharpe Ratio since the arithmetic represents a forward-looking forecast. The Sharpe Ratio represents the total excess return
(reward) per unit of risk. This reward / risk ratio is generally consistent over long periods and thus can be interpreted as a long-term forecast. Finally, the Sharpe Ratio excludes the average cash return since the cash return is deemed to be risk-free. The investor still receives the cash return, but for forecasting the future reward / risk ratio it is excluded.
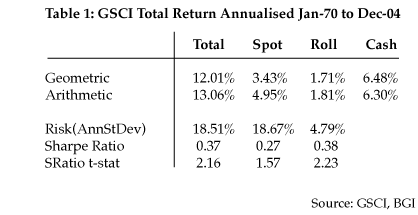
Table 1 highlights several important commodity return characteristics. The overall Sharpe Ratio is relatively high, 0.37, and statistically significant at the 95% confidence level.
While total return is the sum of the three sub-components, the total risk is not a sum, since there are diversification benefits within the sub-components.
As previously noted, the sources of the spot (capital gains) and roll (insurance premium) returns are not closely correlated, since they derive from different elements of the economic process.
The spot price return, 3.43%, is not insignificant over this time-period. However, the spot price is difficult to forecast especially over intermediate time periods. The roll return though smaller than the spot and cash return, 1.71%, is statistically significant at a level of 95% confidence.
Given the importance the energy sector - which currently comprises 66% of the GSCI - we next decompose the energy and non-energy returns. Since energy futures did not begin trading until the end of 1982, we work with return history from January 1983. The total returns from this shorter period, displayed in table 2, provide the point of comparison for the energy and non-energy returns displayed in tables 3 and 4.
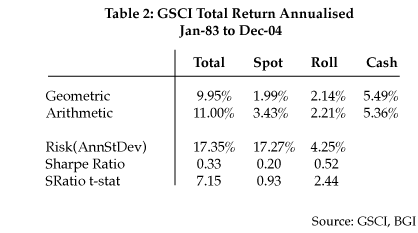

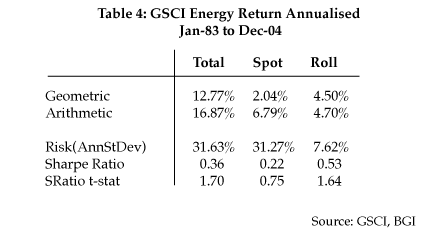
Tables 3 and 4 highlight further insights into commodity return drivers. During the shorter time-period the non-energy commodities do not possess a Sharpe Ratio significantly different from zero. The roll return for non-energy is actually negative during this period, -0.89%.
As mentioned in section (c), commodities with a high cost of carry make a poor financial investment. On the other hand, low cost of carry commodities like non-energy commodities may make good financial instruments but their returns are modest at best. Non-energy commodities may generate a low roll return if: producers believe the benefits of hedging including such factors as the convenience yield are low relative to the costs, the cost of carry is low relative to the cost of hedging the price and the risk of future price spikes is relatively low.
In contrast to the non-energy returns, the energy-only returns show a Sharpe Ratio similar in magnitude to the total returns, 0.36, and are significant at the 90% confidence level. The energy-only spot and roll returns are higher, 6.79% and 4.70%, than the same non-energy and total returns. The energy-only and non-energy commodities are diversifying since the total combination is less risky the each individually. Even though the spot and roll for the total return are smaller than the spot and roll for the energy only returns, 3.43% and 2.21% versus 6.79% and 4.70%, the combined total returns are statistically more significant and therefore less volatile. Further the total and energy-only Sharpe Ratios are similar, 0.33 and 0.36, but the statistical significance of the total Sharpe Ratio increases dramatically from 1.70 to 7.15 when energy and non-energy are combined.
(E) Expectations of the Future Size of the Commodity Risk Premium
We will discuss the likely size of the premium going forward using the simplified equation stated earlier.

We expect the spot return (RSPT) in real terms to be approximately zero over time. Despite the historical evidence that spot returns, particularly energy returns, have been positive on average over the last 35 years, we prefer a conservative position of no real return from the spot price. In other words, our view about the attractiveness of commodities in a strategic asset allocation does not include an assumption of short-, medium- or long-term capital gains based on real price appreciation alone.
Similarly, we anticipate the real return to cash collateral to be zero over time. Even though some investors may choose to assume additional active risk with their cash collateral we prefer a conservative position where the commodity investor assumes risk and return related to commodities but takes no risk and expects no return above the rate of inflation from their cash collateral.
These forecast can be summarised as follows:
This leaves us with the last, most challenging element, which Keynes referred to as the insurance premium: the roll return.
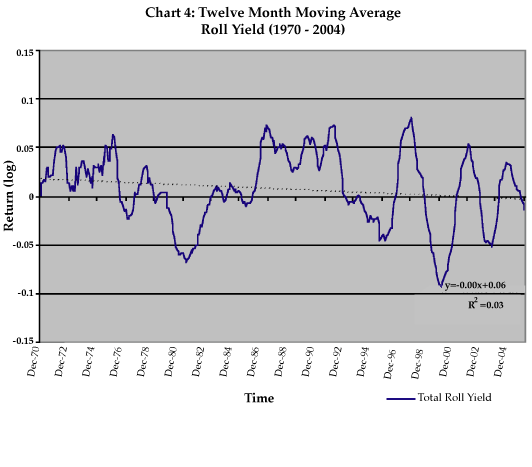
Graph 3 shows the twelve-month moving average of the roll yield for the Total Return GSCI Index as well as the associated Energy and Non-energy Indices.
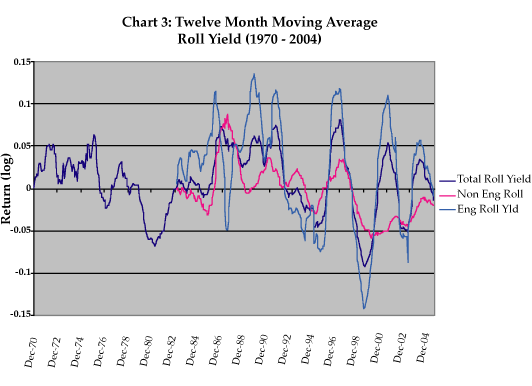
As is highlighted by Chart 3, the roll return has an episodic return history reflecting the changes in the forward curve from the existence of a premium (or backwardation) and
the non-existence of a premium (or contango). This fact combined with the relative short history of the roll return make forecasting its future value difficult.
Table 5 below presents various selected empirical values for the roll return.18 We consider these returns real returns since the cash collateral and spot return provide nominal return for the capital invested equivalent approximately to the rate of inflation leaving the roll return to represent the real return above inflation.
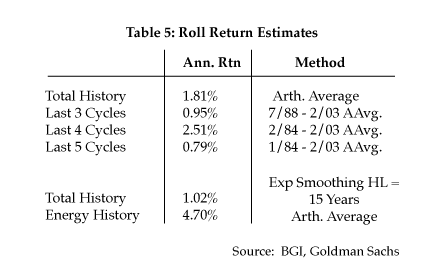
Our best estimate of the roll return is 1.5%. We base this estimate on the following assumption: (1) the roll return has provided sustained positive returns in the past,
over full economic cycles, in other words, the insurance premium is positive; (2) as energy continues to increase its importance in the GSCI it will continue to have a
positive impact on the level of future roll returns; and (3) we do not see strong statistical evidence to be confident that the roll return is decreasing.
Chart 4 demonstrates this third point. The roll return may appear to exhibit a decreasing trend over the last decade but there is no statistical evidence for this decrease. For example,
the equation of the trend line (Y = -0.00X + 0.06) shows virtually no goodness of fit (R2 = 0.03) and the slope of the trend line is zero to two decimal places.19
This brings us to the final estimate for the real return of the commodity investment.
Investors will find that, given the other positive attributes of a commodity investment such as a low and relatively stable correlation with other major asset classes, they still have a strong justification for a modest allocation to commodities within their strategic asset allocation process.
For example, Chart 5 illustrates the gain in efficiency if an investor adds commodities to a strategic asset allocation mix of: US equities, US treasuries, US corporates and listed property.
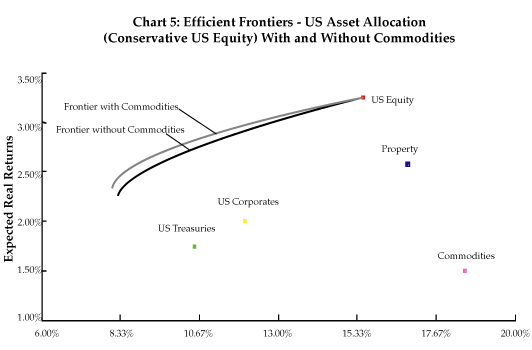
Table 6 below lists the inputs to the strategic asset allocation model illustrated above. Higher real returns were added to US equity to stress the role of the commodity allocation. The conservative forward-looking real return estimate for US equities (Con.) is 3.25%; the medium estimate (Med.) is 3.5% and the aggressive estimate (Agg.) is 5.0%. The expected risk-adjusted return or Sharpe ratio for commodities is around two to three times smaller than the other major asset classes.
20
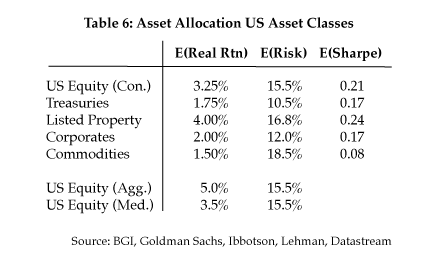
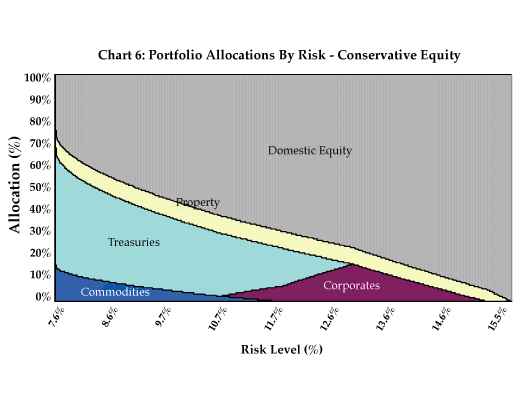
The recommended allocation weight to commodities ranged from 16% to 0%. Chart 6 shows that portfolios with a lower target risk preferred commodities as compared with portfolios with a higher target risk. This evidence reflects the fact that an allocation to commodities functions as a conservative component in strategic portfolio construction.
Finally, our forecast of the total commodity return is the rate of inflation, currently around 2.5%, plus the real return contributed by the roll return of 1.5%.
Thus the forwarding looking total return for commodities is around 4.0%.
Thus, despite the fact that historically there has been a positive real risk premium of 2.9% versus the risk free rate (i.e. 10 year US Treasuries), our forward-looking risk premium relative to the 10-year US Treasury is flat, or slightly negative.
(F) A Review of Arguments Against a Risk Premium for Commodities
Not everyone accepts the case for a risk premium for commodities. Critics of the concept tend to fall into three camps. First, there are those who regard investment in commodities as pure speculation, which has no useful economic purpose and therefore is not the sort of investment that would attract a risk premium. Second, there are those who have tried to devise ways of measuring the risk premium but have not been able to establish its existence on a reliable and sustainable basis. Third, there are those who challenge Keynes' idea of an insurance premium, arguing that this is not how commodity market participants actually think about what they are doing.
21
Commodity investment as pure speculation?
Given the volatility over time of spot prices for commodities and the tendency of particular commodities to lose their economic importance due to changes in taste or manufacturing
processes, some argue that investment in commodities is pure speculation, in the pejorative sense of that term: in other words, it is more like gambling at a casino that investing in a financial asset. If this were the case, then there would be no reason to expect a premium for taking exposure to commodities as an asset class. Some investors may make money from holding commodity futures, but this is down to luck and not the result of a risk premium.
Commodity investment differs from gambling in an important respect. When two players gamble on cards, or sports results or any other activity, their action of placing bets increases the amount of risk in the world. The game of cards or the race could have taken place without the bet and without the risks that the bet entails. While these risks may net to zero (that is, what I stand to gain is the exact opposite of what you stand to lose) the gross amount, or quantum of risk has risen. Moreover, the degree to which this quantum has increased is determined by the participants in the bet, any not by any feature of the game of cards, or race upon which the bet is made.
These characteristics of gambling are clearly not present in the activity of commodity investment, whereby risk is transferred from one party to another,
but is not necessarily increased in any way.22 Commodity investors are providing capital and liquidity to an already existing market in which producers (sellers) and consumers (buyers) of commodities are already exposed to a number of risks, namely changes in supply and demand, changes in extraction and distribution costs and changes in the costs of holding inventory, all of which may lead to price fluctuations. These risks may be retained by the producers and consumers, or they may be laid-off onto investors who are willing to assume them. Either way, risk does not increase but is distributed differently. The investor provides an economic service to the other participants in the market for which they are recompensed via the risk premium.
Empirical evidence for the commodity risk premium?
The second argument is concerned less with the theory of the risk premium and more with the practical difficulty of measuring it. There have been a large number of studies of
different commodity prices over different periods of time all of which have tried to discover whether investors are rewarded or not and if so by how much.23 The conclusions of these studies are mixed: some authors argue that there is some evidence for a risk premium and others that there is not. In the absence of conclusive empirical evidence, is it reasonable to assume that the risk premium really exists?
In part, the answer to this question can be made by analogy to the equity markets. Empirical studies that have tried to demonstrate the existence of an equity risk premium, for which there is widespread support amongst economists and finance theorists, have not always been able to prove their case. First, in many markets there have been long periods during which the price of equities has fallen, implying a negative "premium"; second, in certain other markets there have been political crises that have led to the appropriation of investors' wealth by the new government. In both of these cases it matters very much which markets and which time-periods are chosen in order to establish the fact of the equity risk premium.
As the data presented in section (a) and section (d) suggest, over the past 35 years there is evidence that investment in commodities via the GSCI would have provided a risk return profile that is reasonably similar to that of US equities. This data also suggests that the investor requires a long holding period in order to avoid the risk of returns that are materially out of line with the long-run average. We think this data provides reasonable empirical grounds for believing in a risk premium for commodities, even if that premium is not evident over all short-run time periods and even if the size of that premium can be negative relative to the yield on the 10 year US Treasury.
The intentions of the buyers of the insurance premium?
Finally, it is not clear that commodity producers think of themselves as buying insurance when they sell risk exposure to financial investors. Nor is it clear that they all want to hedge their risk exposure (or, that they want to hedge all of their risk exposure). Some observers have suggested that commodity producers are simply happy to use the futures market to increase their returns, exploiting their information advantage with regard to supply and demand trends and expected spot price movements. If this is the case then the idea of a risk premium for commodity investors may by illusory, attracting capital into the commodity markets simply to the benefit of commodity producers and other insiders in the marketplace.
It is quite likely that firms that are involved in extraction and distribution of commodities will use their knowledge and experience of the markets to make additional returns by
buying or selling in anticipation of spot price movements. We saw earlier, that the distinction between financial investment and business investment is based upon the
intention of the purchaser and not the character of the asset that is purchased. So, for example, a flour producing company may buy more wheat than it needs to meet
its production targets, because it takes the view that the price of wheat will rise and it plans to sell its surplus wheat for profit.
In this case the company is acting both as a flour producing business and as investment company: the one action of buying wheat reflects two separate and rather different intentions.
The possibility that some companies will conflate their normal business activity with investment activity does not harm the claim that investors are paid a risk premium for providing
capital to the commodity markets.24 The risk premium's existence is not dependent upon the beliefs of commodity producers; rather, it depends upon the willingness of some (but not necessarily all) of them to hedge some (but not necessarily all) of their price risk exposure. Further, it does not matter that some commodity market insiders think that they have a better view than the average investor about the likely direction of spot prices. They may or may not be right about their information advantage, but so long as some of them want to diversify their risk they will be willing to forego some potential upside to limit their downside.
In summary, the case for the commodity risk premium is based on two elements: the theoretical argument that suggests that investors should be compensated for the transfer of risk undertaken and the empirical argument that over time they have indeed compensated. In this respect the argument is similar to that which can be made for the existence of an equity risk premium: there is a theoretical reason why it should exist and there is data to suggest that it does exist.
The fact that it is sometimes difficult to measure, that it is sometimes negative, that not all market participants or observers believe that it exists (there are still plenty of people who believe that stock-markets are nothing more than gambling: "casino capitalism"), are all interesting features of risk premia in general, but not decisive when it comes to establishing whether or not they exist.
(G) Conclusions
In this paper we have considered empirical evidence for the existence of a risk premium for commodity investment, together with theoretical arguments that support its existence. We think the evidence is compelling, if not conclusive; and sufficient for investors to be willing to make long-term asset allocations to commodities as an asset class.
Indeed, the diversification benefits that an allocation to commodities will bring to an overall asset-allocation are such that the size of the risk premium for commodities does not need to be very significant for the rational investor to make the allocation: the improvement to the investor's overall risk-adjusted returns will nevertheless be significant.
However, there may be concerns about the capacity of the market in commodity futures to absorb significant capital inflows from institutional investors.
If a major part of the risk premium is based on an insurance-type transaction between commodity producers and financial investors, a significant increase in the supply of
financial investment should, other things being equal, lead to a decrease in the size of the risk premium. (This is no different to any other insurance-type transaction.
If the supply of insurance capital goes up, so the cost of insurance goes down, and vice versa).
We have previously argued that this problem, although real, is some way from becoming material25. By analogy, we compared the capacity of the foreign exchange market to absorb flows whose sole aim was profit as distinct from flows which exist to facilitate trade or hedge other activity, and which are undertaken without a direct profit motive. While it is difficult to measure exactly what percentage of the foreign exchange market represents financial investment - and we think 10% may be a reasonable approximation - the figure is thought to be sufficiently low for the market to absorb significant increases in such activity before the ability of investors to make profit on the back of not-for-profits flows disappears.
Likewise, in the commodity market, although there has been a significant expansion in the size of institutional and retail financial investment in recent years (see endnote 1)
the amount of capital involved is still small as a percentage of the whole market for commodity production and exchange.
The value of financial investment in the commodity markets, despite its recent rapid growth, is still probably less than 3% of the total value of global commodity production
(which is in excess of $1.5 trillion annually).
Consequently we think not only that there are good reasons for an investor to make a strategic allocation to commodities as an asset class, but also that the market is of sufficient size to absorb new inflows of financial investments for some time. Even if the size of the commodities risk premium were to decline somewhat, due to an increase in financial investment, the diversification benefits of commodities are such that it would still make sense to hold commodities as one asset class amongst many in a well diversified investment portfolio.
Endnotes
1 According to Barclays Capital, institutional and mutual fund commodity assets under management have grown from $5bn to $40bn, from 1999 to 2004, an annual compounded growth rate of 50%.
2
For example, Gorton and Rouwenhorst, "Facts and Fantasies About Commodity Futures", Yale ICF Working Paper, no. 04-20 (June, 2004);
Erb and Harvey, "The Tactical and Strategic Value of Commodity Futures", NBER Working Paper, no. 11222 (March, 2005); Norrish et. al.,
"Commodities: The Case for Strategic Investment", Barclays Capital Equity Guilt Study, (February, 2004).
3
The 10-year yield differs from the return an investor might receive from a fund based on the 10-year US Treasury. The latter involves choices on the part of the asset owner and manager, whereas the former approach makes no assumptions about manager skill or index construction.
4
"What Makes a Good Commodity Index?" Research Insights, Barclays Global Investors (July, 2004).
5
As of 31 December 2004.
6
Gorton and Rouwenhorst (2004) estimate a lower commodity risk premia over bonds, 1.43%. They use a longer time-period, July 1959 to March 2004, but they reconstruct a commodity index using equal-weights for each commodity, unlike the GSCI.
7
See Dimson. Marsh and Staunton, "Irrational Optimism," Financial Analyst Journal, January/February 2004.
8
For example, A H Willett, The Economic Theory of Risk and Insurance (1901). Keynes' argument is found in vol. II of A Treatise on Money (1930).
9
This is a common feature of markets where risk exposure is obtained by the use of derivatives. Since the purchase of commodity futures requires only a small initial margin, the balance of the investment (which is only required if the futures prices fall in value) can be held in other financial assets, such as government bonds. The investor is able therefore to secure two separate forms of return.
10
The ideas in this section draw on Nicholas Kaldor, "Speculation and Economic Stability", The Review of Economic Studies, vol. VII (1939). Kaldor uses the term "speculation" but we prefer the term "financial investment", which suffers fewer pejorative connotations.
11
The yield of a bond, properly described, is usually the net of the discounted present value of the coupon stream and the discounted change in price from the current market price
to the maturity price (usually par) when the capital is repaid. There are a number of variants to this normal structure, none of which materially impact the main point.
12
Kaldor, op.cit. pg 3.
13
Keynes uses different terminology. He uses the term enterprise for the activity whose primary focus is the prospective yield of an asset over its lifetime,
and the term speculation for the activity whose primary focus is the likely change in price of an asset as market psychology changes.
General Theory of Employment Interest and Money (1936), Ch. 12.
14
Some historical background on commodities markets and futures market is given in L G Telser {ed.}, Classic Futures (2002) in particular Chapters 10,
12 and 14. See also J Baer and G Woodruff, Commodity Exchanges (1929) in particular Chapters 11 and 12.
15
This tends to be the case for futures, whereas swaps and options tend to be traded "over the counter" where liquidity and price transparency are less clear. Futures are more standardized, whereas other derivatives such as swaps and options are more specialized. This suggests that futures will tend to be better instruments for general financial investment in the asset-class, whereas swaps and options will tend to be better instruments for specific (non-standard) hedging requirements.
16
The collateral may be invested in more risky assets, in search of a higher return. However, the investor then runs the risk that a temporary fall in value of their collateral
will lead to a margin call from the exchange, which will require them to make good the loss in their collateral position. Most investors therefore prefer to preserve the capital value of their collateral and take only minimal investment risks with the collateral.
17
See "A raw deal for commodities", The Economist, 15th April 1999.
18
The best unbiased estimator for a time-series with varying volatility is an exponentially smoothed estimate. In this case, the time-series exhibits such strong trends that the selection of an end point severely biases the result thus rendering the exponential smoothing less useful.
19
This goodness of fit describes the proportion of the time-series variation that is explained by the trend line, in this case 0.03 denotes that 3% of the variation is explained by the trend line. In finance one would aspire to a value of at least 0.20 if not higher.
20
The optimisation used exponential smoothing with a 48 month half-life to determine the volatilities and a combination of forecasts and implied returns to determine the return forecasts.
21
A good summary of arguments against the commodity risk premium, including detailed references, can be found in J C Williams, The Economic Function of Futures Markets (1986).
22
It would be possible to gamble on the price of oil, or the amount of copper that can be extracted from a mine in a day. Commodities are potential objects of betting, just like anything else. Our point is that this is not what takes place when an investor buys or sells commodity futures.
23
See L Telser {ed}, Classic Futures (2002) for a sample of these studies and references to others.
24
Similarly, many companies that have expenditures or revenues not in their domestic currency, may decide to hedge or not to hedge their foreign exchange exposure in part according to their view on the likely change in value of their domestic currency. When they do this they are acting in part as a multi-currency business and in part as a foreign exchange investor.
25
See 'The Risk Premium for Commodities', by Mark Hannam and Catherine Barker, BGI January 2004.
|